
You ran your site through Google PageSpeed Insights, or maybe you opened Google Search Console for the first time in a while, and now you are looking at a red label that says Core Web Vitals Assessment: Failed. The score below it might even look decent. The page might feel fine when you use it. So what exactly failed, and does it actually matter?
It does matter. Core Web Vitals are the set of metrics Google uses to measure real user experience on your website, and a failed assessment is a direct signal that visitors are having a poor experience, at least some of the time. That affects both your search rankings and your conversion rate. The good news is that a failed assessment is a solvable problem. Understanding what is actually being measured is the first step, because most of the confusion around this message comes from a common misunderstanding about how Google collects and evaluates the data.
This post explains what the failed assessment means, breaks down each metric in plain terms, covers the most common causes of failure for each one, and walks through how to approach fixing them.
What “Core Web Vitals Assessment: Failed” Actually Means
The assessment result in PageSpeed Insights is based on field data, not the lab score you see just below it. This distinction is the source of most of the confusion people experience when they see a high performance score sitting right next to a “Failed” assessment label.
Lab data vs. field data: The performance score (0 to 100) is lab data. It is a simulated test run in a controlled environment by Google Lighthouse. It is useful for diagnosing issues but does not reflect what real visitors are experiencing. The Core Web Vitals assessment is field data. It comes from the Chrome User Experience Report (CrUX) and is based on actual visits to your site over the past 28 days. This is what Google uses for ranking purposes, and this is what the “Failed” label is reporting on.
To pass the assessment, at least 75% of real user visits must meet the “Good” threshold across all three Core Web Vitals metrics. That is a strict bar. It is not an average, and it is not based on your best-case visitors with fast connections and modern devices. It accounts for the slower end of your real audience, which is exactly the experience that drives users away.
One more rule that catches people out: failing even one metric fails the entire assessment. A combination of two green metrics and one that is borderline amber still returns the red “Failed” label. All three must pass, for at least 75% of visits.
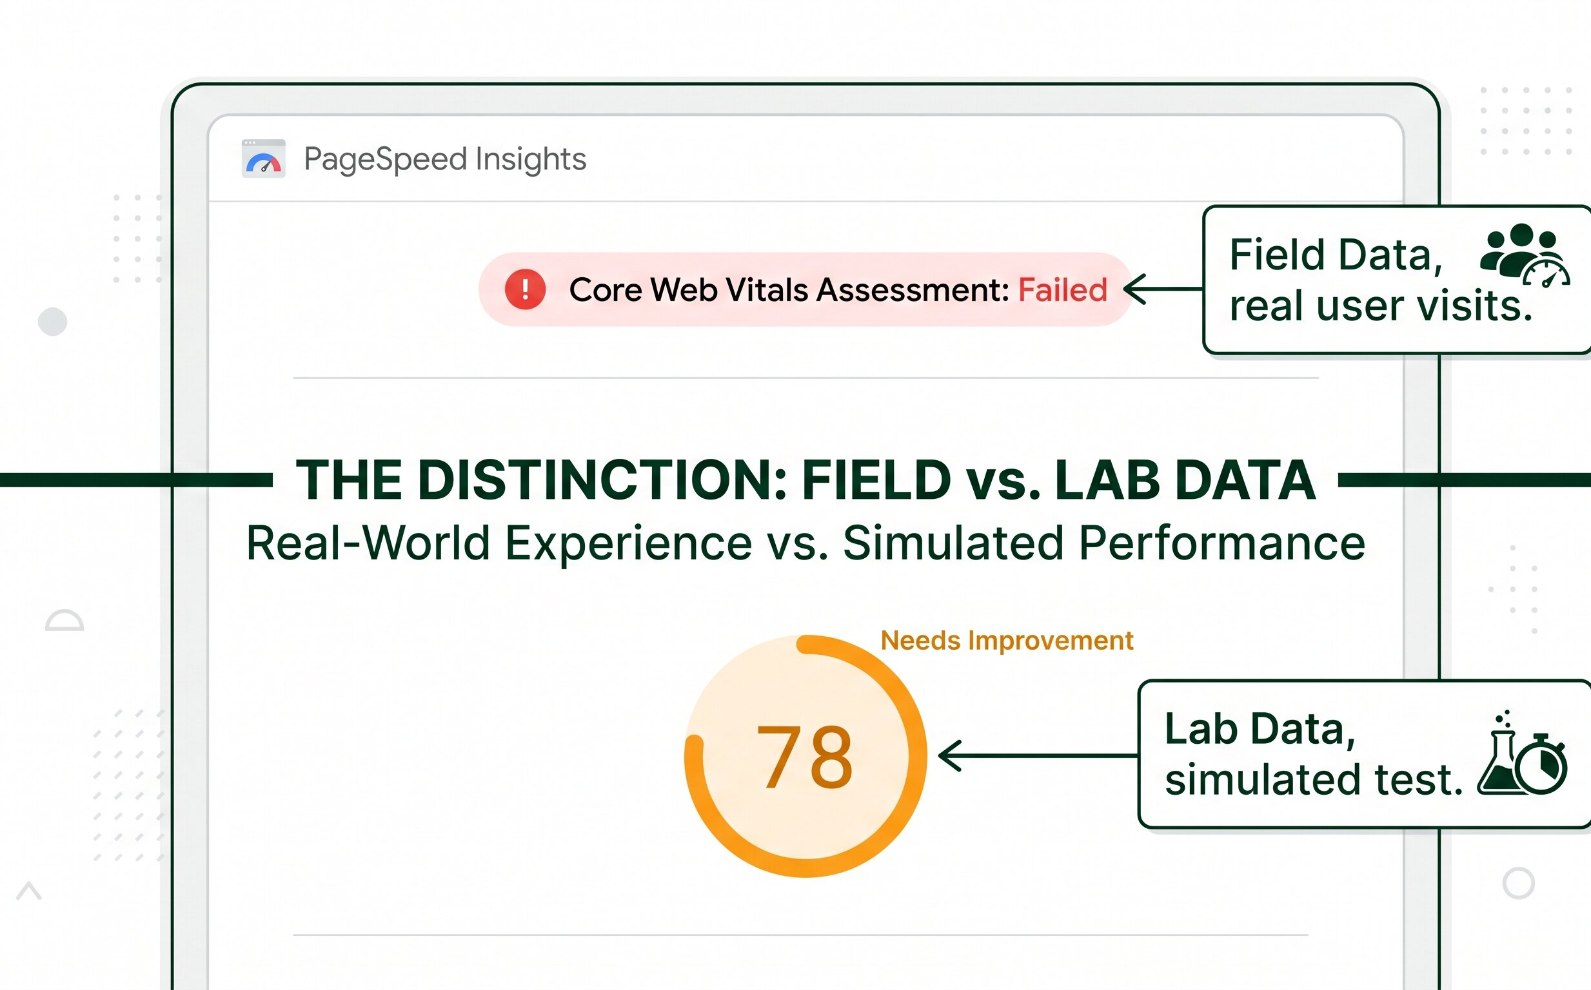
A high PageSpeed score and a failed Core Web Vitals assessment can appear on the same report. They measure different things. The assessment is what matters for rankings and real user experience.
The Three Metrics That Determine Your Result
Each metric measures a different dimension of the user experience. Understanding what each one is measuring helps you connect a failing score to its real-world cause, rather than guessing where to start.
Largest Contentful Paint
LCPMeasures how long it takes for the largest visible element on the page to fully load. That element is typically a hero image, a large heading, or a video thumbnail. LCP is effectively the user’s perception of how fast the page loads its main content.
Good: 2.5 seconds or less | Needs Improvement: 2.5 to 4.0s | Poor: over 4.0s
Interaction to Next Paint
INPMeasures the responsiveness of your page to user interactions throughout the entire visit, not just the first click. Tapping a button, opening a menu, or submitting a form all generate interaction events. INP captures the worst-performing one. It replaced First Input Delay (FID) as the responsiveness metric in March 2024.
Good: 200ms or less | Needs Improvement: 200 to 500ms | Poor: over 500ms
Cumulative Layout Shift
CLSMeasures visual stability. Specifically, it quantifies how much page content unexpectedly shifts position while the page is loading. If an image loads late and pushes the text you were reading down the page, or if a cookie banner pops in and moves a button you were about to click, those are CLS events.
Good: 0.1 or less | Needs Improvement: 0.1 to 0.25 | Poor: over 0.25
Common Causes and Fixes for Each Metric
Why LCP Fails and How to Fix It
LCP failures almost always come down to the server taking too long to respond, the largest element being too heavy to load quickly, or something blocking the browser from rendering it promptly. These are the most common culprits and the typical fixes for each.
Why INP Fails and How to Fix It
INP failures point to JavaScript problems. When a user clicks or taps something and the page takes a long time to respond, it is almost always because the browser’s main thread is busy processing JavaScript and cannot handle the interaction promptly.
Why CLS Fails and How to Fix It
CLS failures are usually caused by elements that the browser does not know the size of until they load, causing surrounding content to shift when they appear. They are often the most visually obvious failures, because users can see the page jumping around.
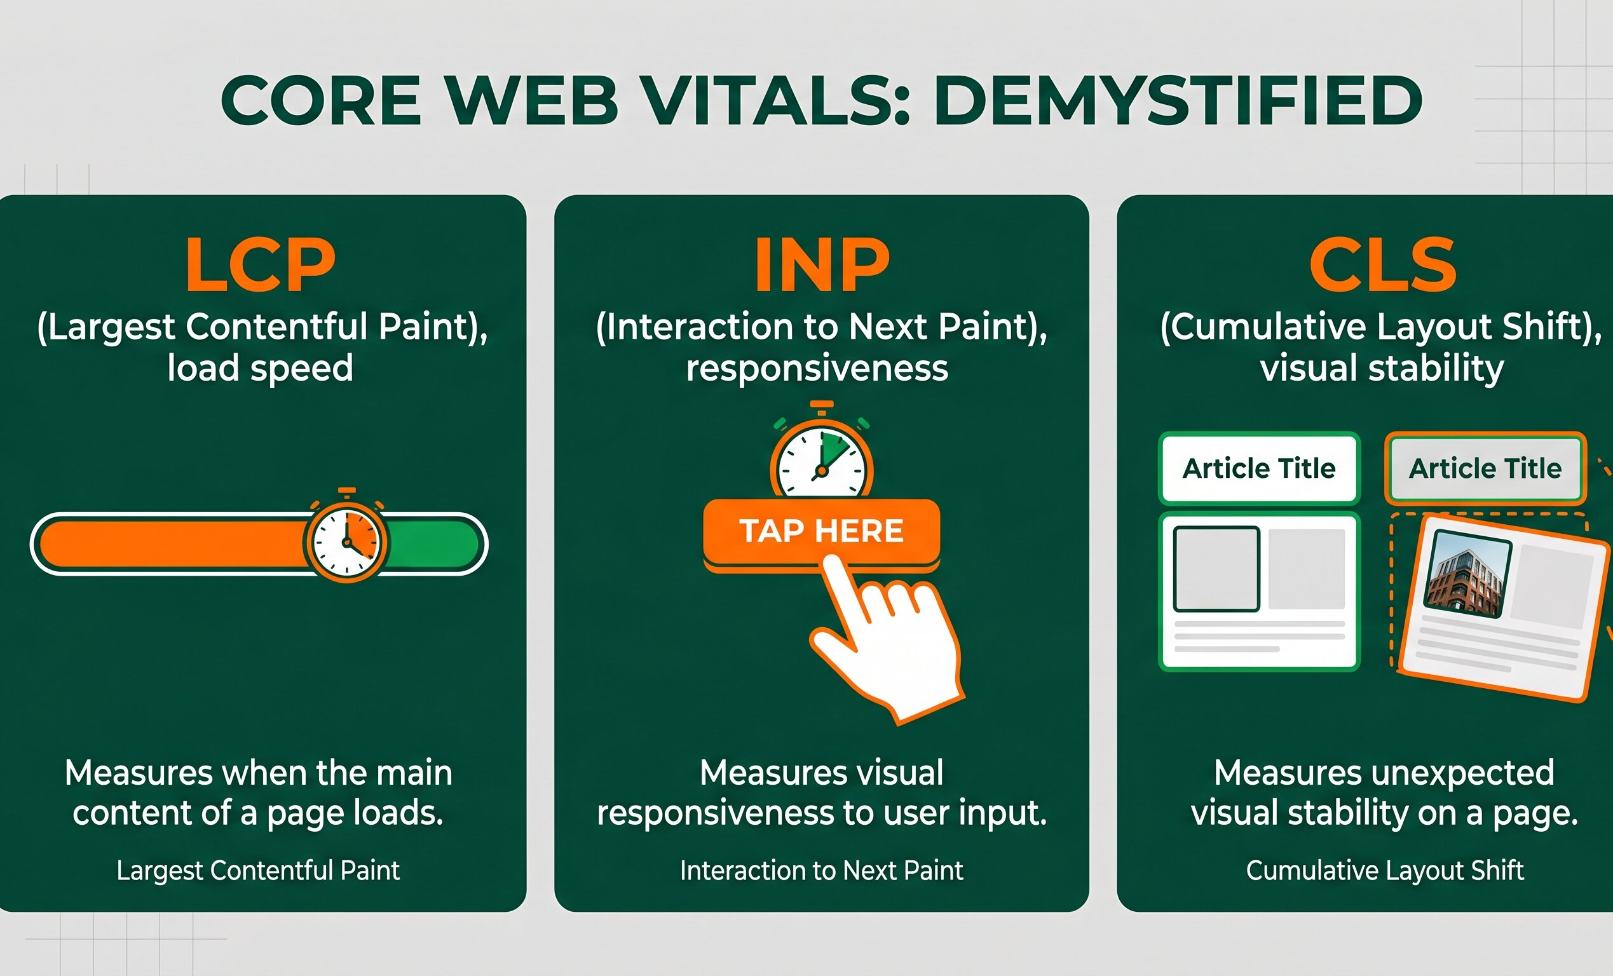
Each Core Web Vitals metric targets a distinct part of the user experience: how fast content loads, how quickly the page responds to input, and how visually stable the layout is while loading.
How to Diagnose Which Metric Is Failing Your Site
Before fixing anything, you need to know which metric is responsible and on which pages. A sitewide “Failed” label does not tell you whether the problem is LCP on your homepage, CLS on your blog posts, or INP across your whole site. Here is a practical sequence for finding out.
Start with Google Search Console
Navigate to the Core Web Vitals report under Experience. This shows you which URLs are failing, which metrics are responsible, and how many pages are affected. It groups pages by issue type so you can prioritize by the ones causing the most widespread impact rather than chasing individual pages.
Run PageSpeed Insights on specific failing URLs
Take a failing URL from Search Console and run it through PageSpeed Insights. Focus on the field data section at the top to see your actual metric scores. The lab data section below it will give you diagnostic information on what to fix, but remember those are simulated scores, not real user measurements.
Check the “Opportunities” and “Diagnostics” sections
PageSpeed Insights lists specific issues contributing to each metric failure, with an estimated time saving for each fix. Work through these in order of impact. The items with the largest estimated savings are your highest-priority fixes.
Allow 28 days after making fixes before judging the result
Field data in CrUX is collected over a rolling 28-day window. If you fix an LCP issue today, your assessment result will not reflect that improvement for up to 28 days, because the old data is still in the window. Lab scores in PageSpeed Insights will update immediately after your fix, which is a useful confirmation that the change worked, even before the field data catches up.
A Note on Low-Traffic Pages
If you see pages flagged in Search Console that you know have been fixed but are still showing as failing, it may be a traffic volume issue rather than a performance issue. CrUX requires a minimum amount of real Chrome user visits to generate field data. Pages with very low traffic may not have enough data to produce a valid assessment, and in some cases they will continue showing as failing simply because Google cannot collect enough visits to update the result.
If lab data in PageSpeed Insights shows all metrics in the green for a page that Search Console still flags as failing, the most likely explanation is insufficient field data on that specific URL. Focus your optimization energy on high-traffic pages first. Those are the ones where passing the assessment will have a measurable impact on rankings and user experience.
When You Need a Developer to Fix It
Some Core Web Vitals fixes are straightforward. Compressing images, setting size attributes, and removing unused plugins are things a careful site owner can do without writing code. Others are not, and attempting them without technical knowledge can introduce new problems while only partially addressing the original one.
INP failures in particular almost always require developer involvement. Diagnosing which JavaScript tasks are blocking the main thread, splitting bundles, and deferring third-party scripts correctly requires code-level access and an understanding of how the scripts interact. Attempting this through plugins alone rarely resolves the underlying issue and sometimes makes lab scores look better while field data stays the same.
Persistent LCP failures caused by server response time are a hosting problem, not a code problem. If your server is slow, no amount of image compression will fully compensate. The right fix is moving to faster, properly configured hosting with server-side caching and a CDN in place, which is something to address at the infrastructure level rather than through plugins stacked on top of a slow server.
If you have worked through the obvious fixes and your assessment is still failing, or if the diagnostic information in PageSpeed Insights is pointing at issues you are not comfortable addressing, a professional performance audit and maintenance engagement is usually faster and more reliable than continuing to troubleshoot independently.
Frequently Asked Questions
Does a failed Core Web Vitals assessment directly hurt my Google rankings?
Yes, Core Web Vitals are a confirmed ranking signal as part of Google’s Page Experience update. However, they are one signal among many, and Google has stated that a page with excellent, highly relevant content can still rank well even with suboptimal Core Web Vitals. In practice, for competitive keywords where multiple pages have strong content, Core Web Vitals performance can be the tiebreaker. For most business sites, the more immediate impact of poor Core Web Vitals is on user behavior: higher bounce rates, lower time on site, and fewer conversions, all of which indirectly affect rankings over time.
Why does my PageSpeed score look good but the assessment still says Failed?
Because they measure different things. The PageSpeed score is generated by Google Lighthouse in a simulated, controlled lab environment. The Core Web Vitals assessment is based on real visitor data collected by Chrome over the past 28 days. Real visitors use different devices, different network speeds, and interact with your site in ways a controlled test cannot fully simulate. It is entirely possible to score 90 in lab conditions while failing the field-data assessment, particularly for INP, which requires real user interaction to measure.
How long does it take to fix a failed Core Web Vitals assessment?
The technical fixes themselves can often be implemented within a few days to a couple of weeks depending on complexity. The assessment result in Search Console and PageSpeed Insights will then take up to 28 days to reflect those improvements, because CrUX data is collected over a rolling 28-day window. Do not judge the effectiveness of your fixes by the field data assessment immediately after implementing them. Use lab data and PageSpeed Insights scores as your near-real-time indicator that the fixes are working, and monitor field data over the following month.
Should I use a plugin to fix Core Web Vitals?
Performance optimization plugins like WP Rocket, NitroPack, or Perfmatters can address some Core Web Vitals issues effectively, particularly around caching, image optimization, and deferring certain scripts. They are a reasonable starting point and have helped many WordPress sites improve their scores. The limitation is that they work within the constraints of your existing theme and hosting environment. If the root cause is a slow server, poorly written theme code, or a conflict between plugins, a caching plugin alone will not resolve it. Plugins that promise a 100 PageSpeed score by aggressively deferring JavaScript can also produce misleading lab scores while leaving real user INP unchanged or worse.
My assessment says “No Data” instead of Failed or Passed. What does that mean?
A “No Data” result means Google’s CrUX database does not have enough real-world visits from Chrome users to generate a reliable assessment for that URL. This is common for new sites, low-traffic pages, and pages that are not frequently visited by Chrome users specifically. It does not mean the page is failing. You can still use the lab data section of PageSpeed Insights to diagnose and fix performance issues on low-traffic pages, even though they will not have a field-data assessment to pass or fail.
Not Sure Why Your Assessment Is Failing?
We diagnose Core Web Vitals failures, identify the actual root cause rather than surface-level fixes, and handle the technical implementation. If your site is failing and you want a clear picture of what is wrong and what it will take to fix it, start with a free audit.
Get a Free Performance Audit